In today's competitive market, exceptional customer service is a critical driver of business growth and loyalty. But how do you objectively measure what "exceptional" looks like? Moving beyond anecdotal feedback and into data-driven strategy requires a clear understanding of the right metrics. Simply put, you can't improve what you don't measure. Tracking key customer service performance indicators is non-negotiable for any organization serious about retaining customers and protecting its bottom line. These metrics transform abstract goals like "improving satisfaction" into tangible, actionable data points.
This guide provides a definitive breakdown of the most crucial performance indicators that every support team should monitor. We will move past simple definitions to explore how to effectively implement, track, and act upon these KPIs. You will learn not just what each metric is, but why it matters and how to use it to optimize your team's efficiency and impact. We’ll cover everything from foundational satisfaction scores like CSAT and NPS to operational benchmarks like First Call Resolution and Average Handle Time. By the end, you'll have a practical framework for building a service operation that consistently delivers measurable, high-quality results.
1. Customer Satisfaction Score (CSAT)
Customer Satisfaction Score (CSAT) is one of the most direct and widely used customer service performance indicators. It measures how satisfied a customer is with a specific interaction, service, or product. The core of CSAT is its simplicity: a straightforward question asking customers to rate their satisfaction on a numbered scale.

The score is typically calculated by taking the number of satisfied customers (those who rated 4 or 5 on a 5-point scale) and dividing it by the total number of survey respondents, then multiplying by 100 to get a percentage. This metric provides a real-time pulse on customer sentiment at key touchpoints.
How to Implement and Improve CSAT
Implementing CSAT effectively requires a strategic approach to timing, delivery, and follow-up.
-
When to Survey: The best time to send a CSAT survey is immediately after an interaction concludes. For instance, Uber prompts for a ride rating right after the trip ends, and a live chat support system can present the survey as soon as the chat is closed. This timing captures the customer's fresh, unfiltered feelings about that specific experience.
-
Keep it Simple: The strength of CSAT is its brevity. A single question like, "How satisfied were you with your support experience?" is often enough. Adding an optional open-ended question like, "How could we improve?" can provide valuable qualitative context without overwhelming the customer.
-
Actionable Follow-up: A low score is an opportunity. Automate a workflow where a score of 1 or 2 triggers a follow-up email from a team lead or a ticket for a senior agent to review the interaction. This proactive approach can turn a negative experience into a positive one and prevent customer churn.
Key Insight: Segmenting CSAT results is crucial for targeted improvements. Analyze scores by agent, team, channel (email, phone, chat), and issue type. This reveals specific training needs or process bottlenecks that generic, aggregated data would otherwise hide.
2. Net Promoter Score (NPS)
Net Promoter Score (NPS) is a widely adopted metric that measures long-term customer loyalty and brand sentiment rather than satisfaction with a single interaction. It gauges the likelihood of a customer recommending your company, product, or service. NPS is based on a single, powerful question: "On a scale of 0 to 10, how likely are you to recommend us to a friend or colleague?"
Based on their response, customers are segmented into three categories: Promoters (score 9-10), who are loyal enthusiasts; Passives (score 7-8), who are satisfied but unenthusiastic; and Detractors (score 0-6), who are unhappy customers. The final score is calculated by subtracting the percentage of Detractors from the percentage of Promoters. This makes NPS a potent customer service performance indicator for predicting business growth.
The infographic below illustrates how these customer segments contribute to the overall score.
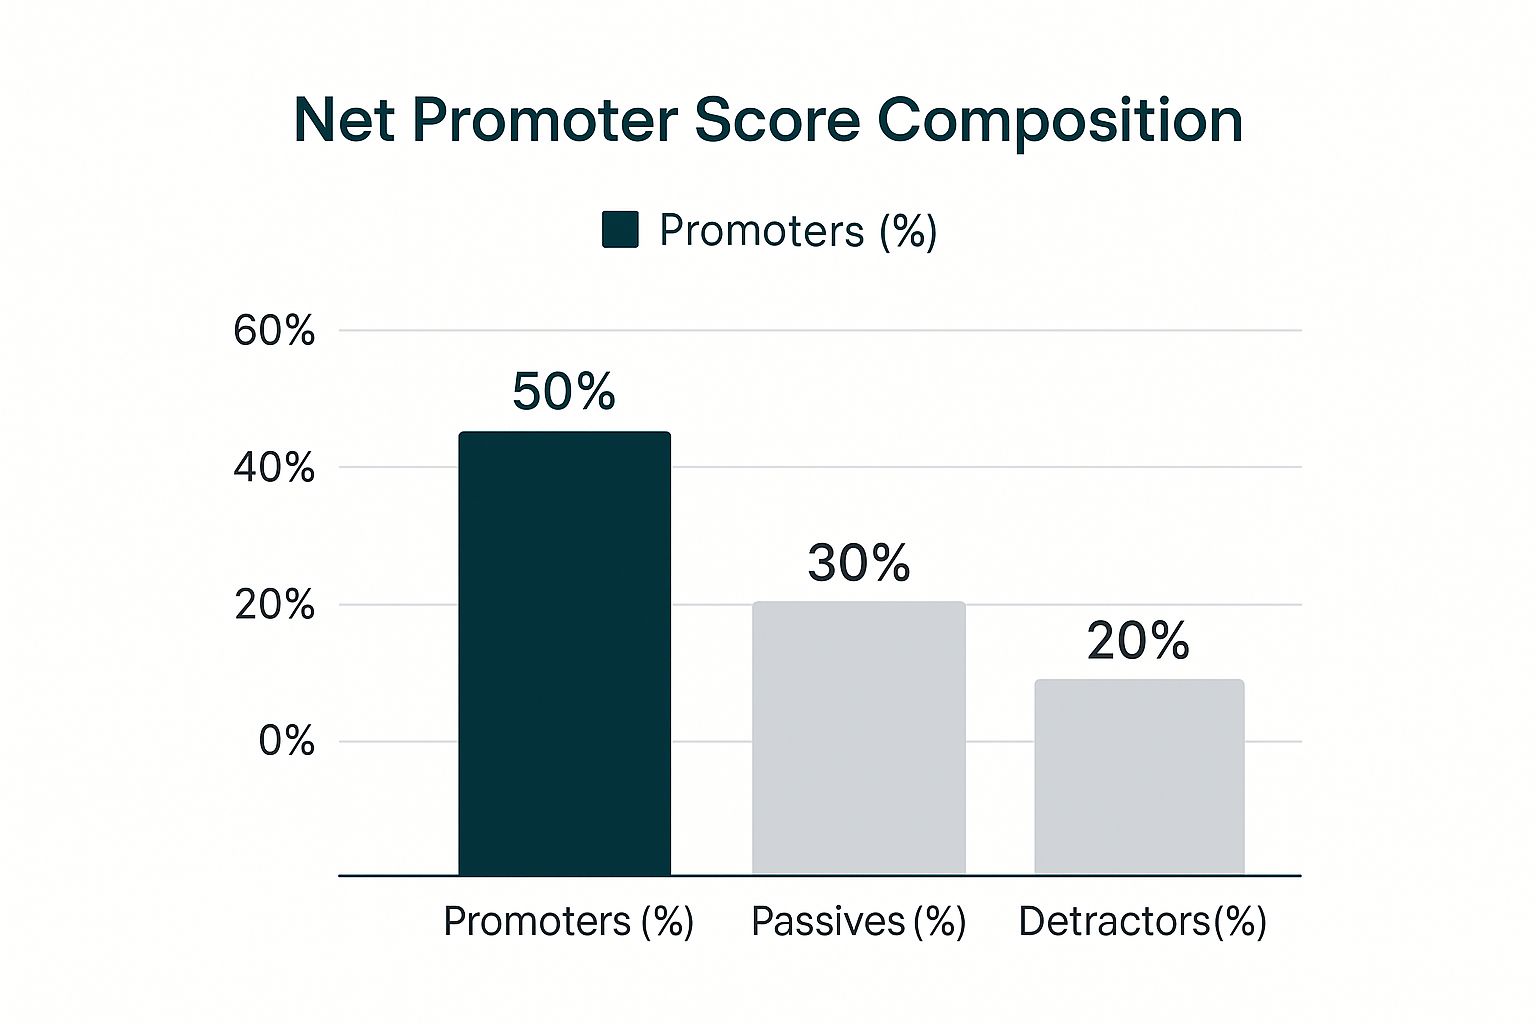
This bar chart highlights the clear division between loyal advocates and at-risk customers, demonstrating why even a high number of satisfied "Passives" does not directly improve your score.
How to Implement and Improve NPS
Successfully leveraging NPS involves consistent measurement, contextual follow-up, and closing the feedback loop.
-
When to Survey: NPS is best used to gauge the overall relationship, not just a single transaction. Send surveys at regular intervals, such as quarterly or semi-annually, or after significant milestones like a customer's one-year anniversary. Companies like Tesla and Apple, known for extremely high NPS scores, use this feedback to maintain their market-leading positions.
-
Always Ask "Why": The number itself is just data; the real value lies in the reasoning behind it. Always include an open-ended follow-up question like, "What is the primary reason for your score?" This qualitative feedback is essential for understanding what you are doing right and where you need to improve.
-
Close the Loop: Actively engage with respondents, especially Detractors. A swift, personal follow-up within 24-48 hours to address their concerns can mitigate damage and sometimes even convert them into loyal customers. Similarly, thanking Promoters can reinforce their loyalty and encourage advocacy.
Key Insight: Treat NPS as a long-term trend indicator, not a daily metric. Focus on the movement of your score over months and quarters. Analyze feedback from each segment to identify systemic issues raised by Detractors, areas for improvement highlighted by Passives, and strengths celebrated by Promoters that can be amplified across the business.
3. First Call Resolution (FCR)
First Call Resolution (FCR) is a critical efficiency metric among customer service performance indicators. It measures the percentage of customer support requests that are successfully resolved during the very first interaction, eliminating the need for any follow-up calls, emails, or chats from the customer. A high FCR rate is a strong signal of an efficient, knowledgeable support team and directly correlates with higher customer satisfaction.

Calculating FCR is straightforward: divide the number of issues resolved on the first contact by the total number of contacts received, then multiply by 100 for a percentage. Companies like Zappos famously prioritize FCR over call time, understanding that a single, quality interaction is far more valuable than multiple, rushed, and unresolved ones. This focus demonstrates respect for the customer's time and effort.
How to Implement and Improve FCR
Boosting your First Call Resolution rate involves empowering agents and optimizing your internal processes.
-
Empower Your Agents: Equip agents with the authority to make decisions, such as processing a refund or offering a discount, without needing supervisor approval. American Express excels at this, giving their representatives the power to solve issues on the spot, which significantly improves FCR and customer loyalty.
-
Build a Robust Knowledge Base: A comprehensive, easily searchable knowledge management system is an agent's best friend. When agents can quickly find accurate information, procedural guides, and troubleshooting steps, they can resolve complex issues confidently and independently during the first contact.
-
Verify True Resolution: Don't assume an issue is resolved just because a call ends. Implement post-interaction surveys or automated callbacks asking, "Was your issue fully resolved today?" This confirms true resolution from the customer's perspective and provides accurate data for your FCR calculation.
Key Insight: Avoid sacrificing quality for speed. Setting an FCR target that is too aggressive can lead agents to rush customers off the phone or mark issues as "resolved" prematurely. The goal is effective resolution, not just first-contact closure. Balance FCR goals with quality assurance scores to ensure you are solving problems correctly the first time.
4. Average Response Time
Average Response Time is a fundamental customer service performance indicator that measures how long it takes for a support agent to provide an initial reply to a customer's inquiry. This metric is a direct reflection of your team's efficiency and availability, and it critically shapes customer expectations across different channels like phone, email, live chat, and social media.
This metric is calculated by summing up all individual response times within a specific period and dividing that by the number of inquiries responded to. For example, if it takes 10, 20, and 30 minutes to respond to three emails, the average response time is (10+20+30) / 3 = 20 minutes. Monitoring this KPI is crucial for ensuring customers feel heard and valued from their very first contact.
How to Implement and Improve Average Response Time
Effectively managing Average Response Time involves setting clear, channel-specific goals and using technology to support your agents.
-
Set Channel-Specific Targets: Response time expectations vary drastically by channel. A customer on live chat expects a reply in under two minutes, while an email response within a few hours is often acceptable. For example, Buffer aims for a social media response within one hour, while HubSpot targets an email response time under four hours. Define and communicate these targets clearly to your team.
-
Use Automated Acknowledgments: For channels like email where an instant human response isn't feasible, use an automated reply. This message should confirm receipt of the inquiry and set a realistic expectation for when the customer will hear back from an agent. This small step manages customer anxiety and buys your team valuable time.
-
Implement Escalation Procedures: Not all inquiries have the same urgency. Create clear rules that automatically escalate high-priority or aging tickets to a senior agent or manager. This ensures time-sensitive issues don't get lost in the queue and prevents customer frustration from boiling over.
Key Insight: Balancing speed with quality is essential. Don't incentivize speed to the point that agents send rushed, unhelpful, or incomplete answers just to meet a target. Combine Average Response Time with a quality metric like CSAT or a peer review score to ensure agents are both fast and effective. This holistic approach drives sustainable performance improvements.
5. Customer Effort Score (CES)
Customer Effort Score (CES) is a powerful customer service performance indicator that flips the traditional satisfaction question on its head. Instead of asking how satisfied a customer was, it measures how much effort they had to exert to get an issue resolved or a question answered. Popularized by research from Gartner and detailed in the book "The Effortless Experience," CES operates on the premise that reducing customer effort is a more reliable predictor of loyalty than simply delighting them.
CES is typically measured by asking a direct question like, "To what extent do you agree or disagree with the following statement: The company made it easy for me to handle my issue." Customers respond on a 7-point scale from "Strongly Disagree" to "Strongly Agree." The score is the average of all responses, providing a clear benchmark for the ease of your service experience.
How to Implement and Improve CES
A low-effort experience is a high-value one. Implementing CES helps you pinpoint and eliminate friction in your customer journey.
-
Survey with Precision: Just like CSAT, the best time to send a CES survey is immediately after a service interaction, such as resolving a support ticket or completing a purchase. This captures the customer's immediate perception of the effort involved while the experience is still fresh.
-
Focus on Friction: The goal of CES is to reduce friction. Use survey feedback to map the customer journey and identify high-effort touchpoints. Is finding your contact information difficult? Is the self-service portal confusing? These are prime areas for improvement. For example, Amazon excels at this by offering robust self-service options for returns, which significantly reduces the effort required from the customer.
-
Empower Your Team: Train agents not just to solve the immediate problem but to anticipate and prevent future issues. Empower them to take ownership and resolve issues in a single contact, which is the ultimate low-effort experience. This proactive problem-solving is a core tenet of improving your CES.
Key Insight: Reducing customer effort is not just about agent interactions. It's about optimizing your entire ecosystem. Invest heavily in your knowledge base, FAQs, and self-service tools. A customer who can easily find an answer on their own without ever needing to contact you has experienced the lowest possible effort.
6. Average Handle Time (AHT)
Average Handle Time (AHT) is a cornerstone of customer service performance indicators, especially within contact centers. It measures the average duration of a complete customer interaction, from initiation to resolution, including talk time, hold time, and any after-call work (ACW) an agent performs to close the case. AHT is a fundamental efficiency metric that directly impacts staffing levels, operational costs, and resource allocation.
It is calculated by adding total talk time, total hold time, and total after-call work, then dividing that sum by the total number of calls. While a lower AHT often suggests higher efficiency, it must be balanced with quality metrics like CSAT to ensure that speed doesn't compromise the customer experience. Companies like Comcast track AHT by service type to set realistic benchmarks for different interaction complexities.
How to Implement and Improve AHT
Optimizing AHT is about enhancing agent efficiency, not rushing customer conversations. Effective management requires a focus on tools, training, and intelligent analysis.
-
Segment Your Data: A blanket AHT target is ineffective. Segment AHT goals by interaction type (e.g., billing inquiry vs. technical troubleshooting), channel, and agent experience level. This provides more accurate and fair performance benchmarks. For instance, a complex tech support call will naturally have a higher AHT than a simple password reset.
-
Empower Agents with Tools: The biggest driver of high AHT is often an agent struggling to find information. Implement a robust, easily searchable internal knowledge base. Use CRM integrations that provide a unified view of the customer's history, eliminating the need for agents to toggle between multiple systems.
-
Use for Coaching, Not Punishment: Analyze interactions with unusually high or low AHTs during coaching sessions. A high AHT might reveal gaps in an agent's knowledge or a process bottleneck. Conversely, a consistently low AHT could indicate an agent is cutting corners. Use these insights for targeted training and support.
Key Insight: The goal isn't just a lower AHT; it's an optimized AHT. Pair AHT analysis with quality assurance scores and First Contact Resolution (FCR). AHT should decrease because processes are more efficient and agents are better equipped, not because they are sacrificing thoroughness to meet a target.
7. Service Level Agreement (SLA) Compliance
Service Level Agreement (SLA) Compliance is a critical customer service performance indicator that measures a team's ability to meet its service promises. An SLA is a formal commitment between a service provider and a client, defining specific, measurable targets for service delivery, such as response times or resolution times. Compliance is the percentage of interactions that meet or exceed these predefined standards.
This metric is a direct reflection of a company's operational reliability and commitment to its customers. For example, a cloud service provider like Amazon Web Services (AWS) commits to specific uptime SLAs for its services, while logistics companies like FedEx commit to specific delivery windows. Tracking compliance ensures the team is consistently delivering the level of service that customers have been promised.
How to Implement and Improve SLA Compliance
Effective SLA management goes beyond just setting targets; it involves continuous monitoring, communication, and process refinement.
-
Set Realistic and Segmented Targets: Avoid a one-size-fits-all approach. Your SLA for a high-priority, urgent technical issue should be much stricter than for a general inquiry. Set different SLA targets based on ticket priority, channel (e.g., live chat vs. email), and customer tier. This ensures resources are allocated effectively.
-
Monitor in Real-Time: Use help desk software that provides a real-time SLA dashboard. This allows managers to see tickets approaching an SLA breach and reassign them or intervene before the commitment is broken. Visual cues, like color-coding tickets that are nearing their deadline, are extremely effective for agents.
-
Build in Buffers and Automate Warnings: Don't set your internal goals to match the exact SLA you promise customers. Build in a buffer. If you promise a 24-hour response, your internal goal might be 18 hours. Automate system warnings to agents and managers when a ticket reaches 50% or 75% of its SLA time, providing ample opportunity to act.
Key Insight: SLAs are not just internal benchmarks; they are a core part of your customer-facing promise. Align your SLAs directly with customer expectations by surveying them or analyzing their behavior. An SLA that is consistently met but doesn't match what customers actually want or need is a sign of a misaligned service strategy. Regularly review and update your SLAs to reflect evolving customer needs and business capabilities.
8. Customer Retention Rate
Customer Retention Rate (CRR) measures the percentage of customers a company keeps over a specific period. Unlike metrics that focus on single interactions, CRR provides a high-level view of how well your overall service strategy fosters loyalty and long-term value. It's one of the most critical customer service performance indicators because it directly connects support quality to financial stability and growth.
This metric is calculated by subtracting the number of new customers acquired during a period from the total number of customers at the end of that period, dividing that by the number of customers at the start of the period, and multiplying by 100. A high retention rate, like Amazon Prime's 95% annual rate, shows that customer service is effectively building lasting relationships that sustain the business.
How to Implement and Improve CRR
Boosting retention requires a proactive, data-driven approach that goes beyond resolving individual tickets. It involves understanding and shaping the entire customer journey.
-
Correlate Service History with Churn: Analyze the interaction history of customers who have churned. Look for patterns, such as multiple contacts for the same issue, low CSAT scores, or long resolution times. This data helps identify the specific service failures that are driving customers away, allowing you to fix the root cause.
-
Implement Early Warning Systems: Don't wait for a customer to leave. Create alerts for at-risk behaviors, such as a sudden drop in product usage, a series of poor satisfaction ratings, or repeated technical issues. When an alert is triggered, a dedicated retention team or senior agent can proactively reach out to solve the underlying problem and repair the relationship.
-
Focus on Proactive Outreach: Use your customer service team for more than just reactive support. Empower them to conduct proactive check-ins with high-value clients, offer guidance on new features, or share best practices. This transforms the support function from a cost center into a value-creation engine that actively strengthens customer bonds.
Key Insight: Measure retention across multiple time intervals (e.g., monthly, quarterly, annually) and segment the data by customer cohort, acquisition channel, or subscription plan. This granular view reveals which customer segments are most loyal and which are most at risk, enabling you to tailor your retention strategies for maximum impact.
Customer Service KPIs Comparison
| Metric | Implementation Complexity 🔄 | Resource Requirements ⚡ | Expected Outcomes 📊 | Ideal Use Cases 💡 | Key Advantages ⭐ |
|---|---|---|---|---|---|
| Customer Satisfaction Score (CSAT) | Low: simple surveys, quick setup | Low: easy surveys, cost-effective | Immediate feedback on satisfaction; loyalty indicator | Post-purchase/service feedback; benchmarking | Easy to implement; high response rates; cost-effective |
| Net Promoter Score (NPS) | Low to Medium: single-question survey | Low: quick survey, requires samples | Predictive of business growth; identifies advocates/detractors | Quarterly or major interaction loyalty measurement | Strong growth correlation; simple; industry benchmark |
| First Call Resolution (FCR) | Medium: requires tracking resolution | Medium: training & monitoring tools | Improved efficiency; reduced contacts and costs | Customer service centers aiming to minimize repeat contacts | Reduces cost; boosts satisfaction; agent productivity |
| Average Response Time | Low to Medium: automated tracking | Medium: integration across channels | Faster response times; SLA compliance | Multi-channel support measuring speed of reply | Easy to track; optimizes staffing; impacts satisfaction |
| Customer Effort Score (CES) | Medium: careful survey design | Medium: survey deployment & analysis | Measures ease of service; predicts loyalty | Identifying friction in customer journeys | Strong loyalty predictor; highlights process improvements |
| Average Handle Time (AHT) | Medium: call time & work tracking | Medium: performance monitoring | Operational cost management; workforce planning | Call centers focused on balancing efficiency & quality | Direct cost impact; easy benchmarking; identifies training needs |
| SLA Compliance | Medium to High: monitoring & alerts | High: real-time tracking & enforcement | Consistent service delivery; accountability | Contractual service agreements; multi-channel reliability | Sets clear expectations; ensures accountability; supports compliance |
| Customer Retention Rate | Medium: requires data over time | Medium to High: CRM and analytics | Long-term business impact; loyalty measurement | Subscription/SaaS, membership, and loyalty program monitoring | Correlates with revenue; indicates service effectiveness |
From Data to Decisions: Activating Your KPIs
Navigating the landscape of customer service can feel complex, but the eight customer service performance indicators we've explored provide a clear and reliable map. From the immediate feedback of CSAT and the loyalty insights of NPS to the operational efficiency measured by AHT and FCR, each metric offers a unique window into the health of your customer relationships. Mastering these KPIs is not about chasing numbers; it's about understanding the stories they tell about your customers' journeys.
The true power of these metrics is unlocked when they are viewed not as isolated data points, but as an interconnected system. A low First Call Resolution rate, for instance, doesn't just affect efficiency; it directly impacts Customer Satisfaction and Customer Effort Scores. Similarly, a slow Average Response Time can erode trust and negatively influence your Net Promoter Score down the line. Seeing these connections is the first step toward building a truly customer-centric strategy.
Turning Insights into Action
Transforming raw data into meaningful change requires a structured approach. The goal is to move from a reactive stance, where you're simply fixing problems as they arise, to a proactive one where you anticipate customer needs and continuously refine your service delivery.
Here are actionable next steps to activate your KPIs:
- Establish a Baseline: Before you can improve, you need to know where you stand. Track your chosen KPIs consistently for at least one quarter to establish a clear baseline. This initial data will be your benchmark for all future efforts.
- Set Realistic Goals: Use your baseline data and industry benchmarks to set specific, measurable, achievable, relevant, and time-bound (SMART) goals. For example, aim to improve your FCR by 5% over the next quarter or decrease AHT by 15 seconds without sacrificing CSAT.
- Foster a Data-Driven Culture: Share KPI dashboards and performance insights with your entire team, not just management. When agents understand how their work directly impacts key metrics like Customer Retention Rate, they become more engaged and empowered to contribute to the company's success.
- Analyze and Iterate: Regularly review your performance. Hold weekly or bi-weekly meetings to discuss what the numbers are revealing. Are there patterns? Is a specific type of query consistently leading to low CSAT scores? Use these insights to iterate on your processes, training, and tools.
The Ultimate Goal: Sustainable Success
Ultimately, diligently tracking and acting upon customer service performance indicators is about more than just keeping customers happy. It's a strategic imperative that drives sustainable business growth. Exceptional service, validated by strong KPI performance, becomes a powerful differentiator in a crowded market. It builds unshakable customer loyalty, reduces churn, and turns satisfied customers into vocal brand advocates. By embedding these metrics into the very rhythm of your operations, you create a self-improving engine that not only resolves issues efficiently but also builds lasting relationships, securing your company's success for years to come.
Ready to stop juggling spreadsheets and start making data-driven decisions? CustomerCloud unifies all your customer communications and analytics into a single, powerful dashboard, making it simple to track the KPIs that matter most. See how our platform can transform your service strategy by visiting CustomerCloud to learn more.