In a competitive market, simply satisfying customers no longer guarantees loyalty or growth. The true advantage comes from actively ensuring their success and meticulously measuring that journey. This is where client success metrics become indispensable. These are not just abstract numbers on a dashboard; they are the vital signs of your customer relationships, telling a clear story about loyalty, predicting churn, and illuminating untapped growth opportunities.
Shifting your focus from passive satisfaction scores to proactive success indicators allows you to build stronger, more resilient partnerships. By understanding the specific value customers derive from your product or service, you can intervene at critical moments, enhance their experience, and transform them into vocal advocates for your brand. This guide cuts through the noise to focus on the seven most impactful client success metrics that every forward-thinking business should be tracking.
We will provide a detailed breakdown of each metric, including its definition, calculation method, and industry benchmarks. More importantly, you'll learn actionable strategies for implementing these metrics to drive tangible results. Prepare to turn your raw customer data into a powerful engine for strategic decision-making and sustainable growth, solidifying your position in the market.
1. Net Promoter Score (NPS)
Net Promoter Score, or NPS, is a cornerstone of client success metrics, designed to gauge customer loyalty with a single, powerful question: "On a scale of 0-10, how likely are you to recommend our company/product/service to a friend or colleague?" Developed by Fred Reichheld and Bain & Company, its elegance lies in its simplicity and the actionable insights it provides.
Based on their responses, customers are categorized into three distinct groups:
- Promoters (Score 9-10): Your most enthusiastic and loyal customers who will champion your brand.
- Passives (Score 7-8): Satisfied but unenthusiastic customers who are vulnerable to competitive offerings.
- Detractors (Score 0-6): Unhappy customers who can damage your brand through negative word-of-mouth.
The final NPS score is calculated by subtracting the percentage of Detractors from the percentage of Promoters, resulting in a score ranging from -100 to +100.
How to Implement and Track NPS
Tracking NPS effectively requires a systematic approach. A key best practice is to survey customers at consistent, meaningful touchpoints in their journey, such as post-onboarding, after a support interaction, or quarterly for long-term clients. This allows you to measure sentiment when it’s most relevant.
Always pair the standard NPS question with an open-ended follow-up, like "What is the primary reason for your score?" This qualitative feedback is where the true value lies, providing context to the number and highlighting specific areas for improvement. For instance, a tech giant like Apple, known for its high NPS, uses this feedback to refine everything from in-store experiences to software updates.
The following pie chart visualizes a sample distribution of customer responses, breaking them down into the core NPS categories.
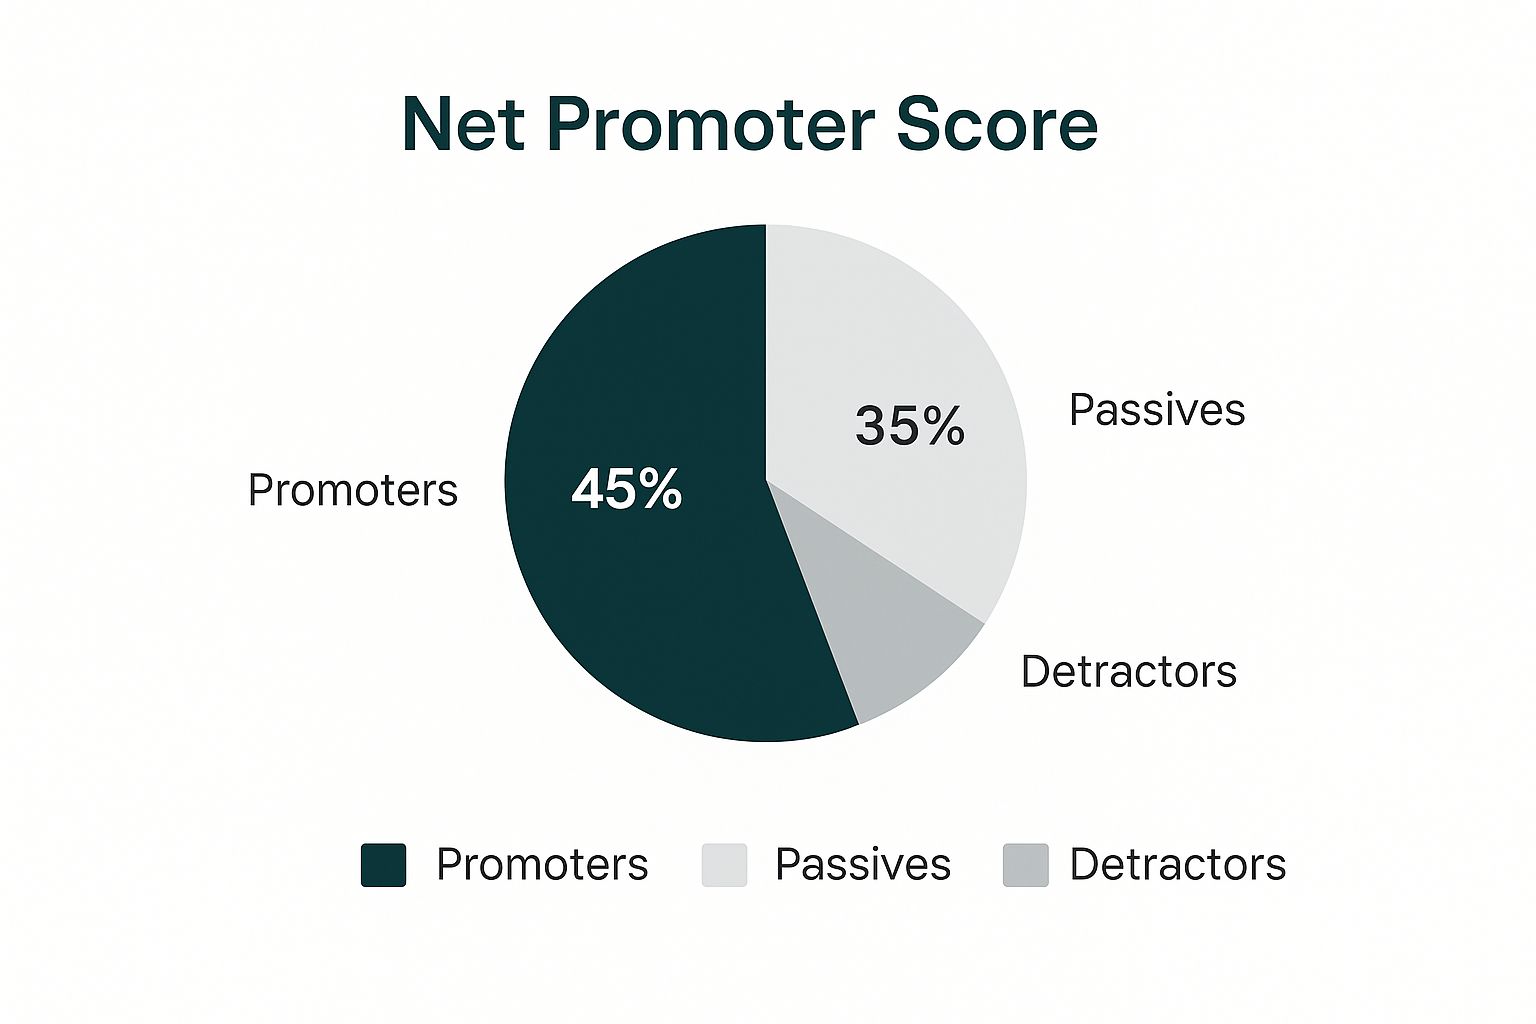
This visual breakdown clearly illustrates how a small segment of dissatisfied customers can significantly impact the overall score, emphasizing the importance of addressing Detractor feedback. By tracking these percentages over time, you can measure the direct impact of your client success initiatives.
2. Customer Satisfaction Score (CSAT)
Customer Satisfaction Score, known as CSAT, is a fundamental client success metric that measures how happy a customer is with a specific interaction, product, or service. Unlike NPS, which gauges long-term loyalty, CSAT provides immediate, transactional feedback. The survey typically asks a straightforward question, such as, "How satisfied were you with your recent experience?" with responses measured on a simple scale (e.g., 1-5 or 1-10).
The final CSAT score is expressed as a percentage of satisfied customers, calculated by dividing the number of positive responses (e.g., scores of 4 or 5 on a 5-point scale) by the total number of responses, then multiplying by 100. This metric offers a real-time pulse on the quality of individual touchpoints across the customer journey.

This visual representation shows a sample breakdown of CSAT responses. The high concentration of "Satisfied" and "Very Satisfied" responses directly contributes to a strong overall score, signaling that a specific interaction or service met or exceeded customer expectations. Tracking this percentage helps pinpoint strengths and weaknesses at a granular level.
How to Implement and Track CSAT
Effectively tracking CSAT hinges on timing and simplicity. The survey should be deployed immediately following a key interaction to capture the customer's fresh, in-the-moment perspective. Common touchpoints include after a support ticket is resolved, following a product purchase, or upon completion of an onboarding session. For example, Zappos famously leverages post-purchase CSAT surveys to maintain its high service standards, consistently achieving satisfaction rates around 89%.
To maximize response rates and gather meaningful data, follow these best practices:
- Keep it short: Limit surveys to a maximum of 1-3 questions to respect the customer's time.
- Maintain consistency: Use the same rating scale across all touchpoints to create a reliable internal benchmark.
- Ask for context: Always include an optional, open-ended question like, "Could you tell us a bit more about why you chose that score?" This qualitative feedback is crucial for understanding the why behind the number.
By analyzing CSAT trends over time, you can directly measure the effectiveness of your operational improvements, from agent training to product updates, making it one of the most actionable client success metrics available.
3. Customer Effort Score (CES)
Customer Effort Score (CES) is a crucial client success metric that shifts the focus from delight to simplicity. It operates on the principle that loyalty is driven less by spectacular service and more by how easy a company makes it for customers to resolve their issues. CES measures the amount of effort a customer had to personally put forth to interact with your company, typically through a single question like, "To what extent do you agree or disagree with the following statement: The company made it easy for me to handle my issue?"
Popularized by Matthew Dixon and his colleagues at CEB Global through research featured in the Harvard Business Review, the "Effortless Experience" concept proposes that reducing friction is a more reliable path to customer retention. Responses are usually captured on a 1-7 scale, where a higher score indicates lower effort and a more positive experience.
Unlike NPS, which gauges overall loyalty, CES is transactional and provides immediate, specific feedback on a particular process or interaction. This makes it an incredibly powerful diagnostic tool for identifying and eliminating pain points in the customer journey.
How to Implement and Track CES
The key to effective CES tracking is timing and specificity. The survey should be deployed immediately after a specific interaction is completed, such as closing a support ticket, completing a purchase, or finishing the onboarding process. This ensures the customer's memory of the effort involved is fresh and the feedback is highly relevant.
Always focus the question on a distinct process rather than a general feeling. Use consistent, clear wording like, "How easy was it to [achieve a specific goal] today?" This approach yields targeted data that can be directly linked to operational performance. For example, Salesforce uses CES to pinpoint and optimize specific steps within their complex support and product adoption processes, ensuring users can find value with minimal friction.
Combining CES data with process analytics provides a complete picture. If a customer reports high effort, you can dig into your analytics to see exactly where they struggled, such as repeated page visits or long session times. This combination of qualitative feedback and quantitative data enables you to make precise, high-impact improvements. Bank of America successfully used this strategy to streamline its mobile app, drastically reducing customer effort and improving satisfaction.
4. Customer Health Score
The Customer Health Score is a predictive, composite metric designed to give a holistic view of a client's relationship with your business. Unlike single-thread metrics, it aggregates multiple data points to create a comprehensive assessment of customer well-being, signaling whether a client is thriving or at risk of churning. This powerful metric moves beyond simple satisfaction to measure the true, ongoing value a customer receives.
The score is typically calculated by combining and weighting various indicators of client success. These can include:
- Product Usage: How deeply and frequently is the client using your product?
- Support Tickets: The volume and severity of support issues raised.
- Engagement Levels: Participation in webinars, responses to surveys, and communication frequency.
- Financial Data: Timeliness of payments and recent upgrades or downgrades.
By blending these inputs, you can assign a score (e.g., 0-100) or a status (e.g., Red, Yellow, Green) to each account, enabling proactive intervention. For example, a "Green" customer might be a prime candidate for an upsell, while a "Red" customer requires immediate attention from your success team.
How to Implement and Track Customer Health Score
A successful health scoring system is tailored to what "success" means for your specific customers. Start by identifying the most critical behavioral indicators that correlate with retention and growth. It's best to begin with 3-5 key metrics, such as product adoption depth, feature usage frequency, and the number of support tickets.
Weight each metric based on its predictive power. For instance, daily product logins might be a stronger indicator of health for a SaaS company than occasional marketing email opens. Define clear thresholds that trigger specific actions. A score dropping from 85 to 65 could automatically assign a task for a Customer Success Manager to schedule a check-in call. Companies like HubSpot famously used health scoring to pinpoint at-risk customers, allowing them to focus their resources effectively and reduce churn.
Crucially, you must regularly validate and refine your scoring model. Compare your calculated health scores against actual outcomes like churn and renewals over time. This ensures your score remains an accurate and actionable predictor of customer behavior, making it one of the most strategic client success metrics you can deploy.
5. Customer Lifetime Value (CLV)
Customer Lifetime Value, or CLV, is a predictive client success metric that calculates the total revenue a business can reasonably expect from a single customer account throughout their entire relationship. Popularized through research by academics like Sunil Gupta of Harvard Business School, CLV shifts the focus from short-term profits to long-term relationship health. It helps companies make informed decisions on how much to invest in customer acquisition and retention.
CLV provides a clear financial justification for client success efforts. It answers critical business questions, such as:
- How much should we spend to acquire a new customer? (The answer should be less than the CLV).
- Which customer segments are our most valuable?
- How does improving retention impact our bottom line?
Calculating CLV can range from simple formulas (Average Purchase Value x Average Purchase Frequency x Average Customer Lifespan) to more complex predictive models. The core idea remains the same: understanding the long-term financial worth of a client.
How to Implement and Track CLV
Implementing CLV requires a disciplined approach to data collection and analysis. Start by segmenting your customers based on shared characteristics like their industry, company size, or subscription tier. This allows you to identify high-value segments that warrant greater investment. For example, a SaaS company might find that enterprise clients have a 5x higher CLV than SMB clients, justifying a dedicated enterprise success team.
Update your CLV calculations regularly, ideally quarterly or semi-annually, as your business model, pricing, and customer behavior evolve. Global giants use this metric to steer major strategic decisions. Amazon optimizes its Prime membership pricing based on the long-term value of a Prime subscriber, while Netflix uses CLV projections to determine how much it can invest in new content to keep subscribers from churning.
For a more holistic view, consider incorporating indirect value into your calculations when possible. A customer who frequently provides referrals is more valuable than their direct purchases suggest. By tracking referral-driven revenue and attributing it back to the original source, you gain a truer understanding of that client’s total contribution to your business’s growth. This comprehensive perspective is key to mastering client success metrics.
6. Churn Rate
Churn Rate, often considered the arch-nemesis of client success, measures the percentage of customers who discontinue their relationship with your company over a specific period. This is one of the most critical client success metrics because it directly reflects your ability to retain customers, a core function of any success team. A high churn rate can quickly erode profitability and hinder growth, making its measurement essential.
There are two primary ways to look at churn, each offering a different perspective:
- Customer Churn: This is the most common form, calculated as (Customers Lost in Period / Total Customers at Start of Period) x 100. It tells you the raw percentage of clients you are losing.
- Revenue Churn: This measures the percentage of recurring revenue lost from existing customers. It can be more insightful, as losing one high-value client can be more damaging than losing several small ones.
A low churn rate is a direct indicator of a healthy, valuable product and a strong customer relationship. It was popularized and heavily analyzed by SaaS industry leaders like David Skok and Tomasz Tunguz, who established it as a fundamental benchmark for subscription-based business health.
How to Implement and Track Churn Rate
To effectively track churn, you must first define what constitutes a "churned" customer. Is it when they cancel their subscription, fail to renew, or simply become inactive? Once defined, calculate both customer and revenue churn on a consistent basis, typically monthly or annually. For example, a successful SaaS company like Salesforce aims for an annual churn rate below 10%, while a B2C subscription service like Spotify maintains a monthly rate under 5%.
The real power of this metric comes from segmentation. Don't just track the overall number; break it down to uncover deeper insights. Analyze churn by:
- Customer cohorts (e.g., users who signed up in the same month)
- Subscription plan or tier
- Acquisition channel
- Product usage levels
Combining this quantitative data with qualitative feedback from exit interviews or surveys provides a complete picture. This allows you to identify why customers are leaving, whether it's due to price, poor onboarding, or a missing feature. By understanding the root causes, your client success team can develop targeted strategies to improve retention and proactively address issues before they lead to cancellation.
7. Time to Value (TTV)
Time to Value, or TTV, is a critical client success metric that measures the time it takes for a new customer to derive meaningful, tangible value from your product or service. This metric is a direct indicator of the effectiveness of your onboarding process and its ability to meet customer expectations. A short TTV is a powerful predictor of long-term retention, as it validates the customer's purchase decision early and builds momentum for deeper product adoption.
The core concept, heavily promoted by leaders in the product-led growth movement like Wes Bush, is that the first "aha moment" sets the tone for the entire customer relationship. This initial realization of value is what transforms a new user into an engaged, long-term partner. Measuring TTV helps teams pinpoint and eliminate friction points that delay this crucial experience.
Calculating TTV requires first defining what "value" means for your customers. This isn't a one-size-fits-all definition and often varies by product and use case.
- Time to Basic Value: The time it takes for a user to experience the initial, core benefit of your product. For example, Dropbox might measure this as the time to the first file share.
- Time to Exceeded Value: The time it takes for a customer to experience unexpected or advanced benefits, solidifying their loyalty and opening doors for expansion.
How to Implement and Track TTV
Effectively tracking TTV starts with defining clear, measurable value milestones within the customer journey. These milestones should represent undeniable wins for the customer. For instance, the communication platform Slack measures TTV as the time it takes for a new team to send 2,000 messages, a benchmark they identified as a key indicator of long-term adoption.
To optimize this client success metric, you should segment your TTV data. Analyze it by customer size, industry, or initial use case to identify patterns. You may discover that enterprise clients have a longer TTV than SMBs, requiring a more high-touch, tailored onboarding process.
The primary goal is to continuously shorten the TTV. Map out the most common paths successful customers take to reach their first value milestone. Use this data to refine your onboarding flow, in-app guidance, and customer success engagements, creating a streamlined path that accelerates new users toward that essential "aha moment." By focusing on this metric, you directly combat early-stage churn and build a foundation for a healthy, lasting client relationship.
Client Success Metrics Comparison
| Metric | Implementation Complexity 🔄 | Resource Requirements ⚡ | Expected Outcomes 📊 | Ideal Use Cases 💡 | Key Advantages ⭐ |
|---|---|---|---|---|---|
| Net Promoter Score (NPS) | Low – simple survey and scoring | Low – single question, easy deployment | Measures loyalty, predicts growth | Tracking overall customer loyalty and benchmarking | Easy to track, strong revenue correlation |
| Customer Satisfaction Score (CSAT) | Low – quick post-interaction surveys | Low – short, event-specific surveys | Immediate customer satisfaction feedback | Assessing satisfaction on specific interactions | High response, actionable immediate feedback |
| Customer Effort Score (CES) | Low to Medium – focused question design | Low to Medium – process-specific | Predicts repeat purchase; identifies friction | Measuring ease of task completion | Strong predictor of loyalty, operational insights |
| Customer Health Score | High – composite metric requiring customization | High – data integration and analysis | Comprehensive customer view; risk prediction | Proactive churn prevention and success management | Multi-dimensional, scalable, real-time monitoring |
| Customer Lifetime Value (CLV) | Medium to High – requires historical and predictive data | Medium to High – data-heavy models | Revenue prediction; guides investment decisions | Long-term strategic customer investment | Identifies valuable segments, supports planning |
| Churn Rate | Medium – requires tracking over time | Medium – cohort analysis and segmentation | Measures retention loss; financial impact | Monitoring retention and revenue loss trends | Clear business health indicator, easy communication |
| Time to Value (TTV) | Medium – defining and tracking milestones | Medium – customer journey analytics | Early satisfaction measure; churn reduction | Optimizing onboarding and customer success | Drives faster value realization, reduces early churn |
From Metrics to Momentum: Activating Your Client Success Data
Navigating the landscape of client success requires more than good intentions; it demands a data-driven compass. Throughout this guide, we've unpacked seven critical client success metrics, from the forward-looking Net Promoter Score (NPS) to the foundational Churn Rate. Each metric offers a unique lens through which to view your customer relationships, providing a comprehensive picture of sentiment, loyalty, and overall health.
You now have the definitions, benchmarks, and tracking methods for CSAT, CES, Customer Health Score, CLV, and Time to Value. But remember, collecting this data is just the starting line. The real transformation happens when you move from passive measurement to active strategy. These numbers are not just report card grades; they are signals, prompts, and roadmaps for action. A dip in your Customer Health Score isn't a failure; it's an early warning system prompting proactive outreach. A high Customer Effort Score is not a complaint; it's a direct request to streamline your processes.
Turning Insights into Actionable Strategy
The core takeaway is that these metrics are interconnected. A faster Time to Value (TTV) directly influences your Customer Satisfaction Score (CSAT), which in turn can boost your Net Promoter Score (NPS) and ultimately increase Customer Lifetime Value (CLV). Isolating them misses the bigger picture. The goal is to build an ecosystem where these data points talk to each other and inform a unified client success strategy.
To make this tangible, consider these next steps:
- Start Small, Scale Smart: Don't try to implement all seven metrics at once. Choose one or two that address your most pressing business questions. Is customer loyalty a concern? Start with NPS. Are you worried about the onboarding experience? Focus on Time to Value.
- Integrate and Automate: Manually tracking these KPIs is unsustainable. Integrate them into your CRM or a dedicated customer communication platform. This allows you to create automated workflows, such as triggering a check-in email when a customer's health score drops or sending a thank you message after a high CSAT rating.
- Empower Your Teams: Data should not live in a silo. Make these client success metrics visible and accessible to everyone, from CSMs and support agents to marketing and product teams. When everyone understands the "why" behind their work, they become more invested in driving positive outcomes.
The Ultimate Goal: From Retention to Advocacy
Mastering your client success metrics does more than just reduce churn; it builds momentum. It transforms your customer success function from a cost center into a powerful revenue engine. By listening to what your data is telling you, you can anticipate needs, solve problems before they escalate, and create experiences that don't just satisfy customers but turn them into vocal advocates for your brand. This proactive, data-informed approach is your greatest competitive advantage, turning healthy customer relationships into sustainable, long-term growth.
Ready to unify your customer conversations and act on your client success metrics in real-time? CustomerCloud centralizes your communications across channels like WhatsApp and email into a single collaborative inbox, giving you the tools to turn data insights into meaningful customer engagement. See how our platform can help you build stronger, more profitable customer relationships by visiting CustomerCloud today.