Making decisions based on data isn't some abstract corporate goal; it's about using real facts, metrics, and customer insights to make smart, strategic moves. You're swapping out gut feelings and intuition for cold, hard evidence that points you toward your objectives.
Why Data-Driven Decisions Are Your New Competitive Edge

Let's be clear: getting serious about data isn't just another trend. It’s a massive shift in how successful businesses actually run. Building a formal data-driven decision-making process is no longer optional—it's essential for staying relevant and growing in a crowded market.
This is what separates the businesses that are always one step behind from those that spot opportunities before anyone else.
Think about a marketing team that used to throw its budget at whichever social media platform felt like the buzziest at the moment. After switching to a data-first mindset with CustomerCloud's engagement analytics, they saw something surprising. Their most valuable customers weren't coming from flashy platforms but from targeted WhatsApp broadcasts—a channel they'd barely funded. This one insight allowed them to pivot their spending and see a huge return.
From Guesswork to Growth
This change is so much more than just staring at dashboards. It's about fostering a culture where everyone, from sales reps to support agents, is encouraged to ask, "What does the data tell us?"
When that question becomes second nature, every corner of your business starts to level up:
- Product Development: You stop building features on a hunch. Instead, you analyze how people actually use your product, pinpointing their frustrations and doubling down on what they love.
- Customer Support: By tracking support tickets and interactions, you can spot recurring problems. This lets you get ahead of them with helpful FAQ articles or automated responses, freeing up your team to handle the truly tough cases.
- Marketing Strategy: A/B testing your messaging and digging into campaign metrics shows you exactly what connects with your audience. No more wasted ad spend on campaigns that fall flat.
To really understand the difference, it helps to see the two approaches side-by-side. One is based on experience and instinct, while the other is grounded in objective reality.
Data-Driven vs Intuition-Based Decisions
| Attribute | Intuition-Based Approach | Data-Driven Approach |
|---|---|---|
| Foundation | Gut feelings, personal experience, anecdotes | Hard data, metrics, verified trends |
| Risk Level | High; susceptible to personal bias and emotion | Low; decisions are verifiable and objective |
| Consistency | Inconsistent; depends on the individual making the call | Consistent; based on a reliable, repeatable process |
| Outcome | Hit-or-miss; can lead to big wins or big failures | Predictable; leads to incremental, sustainable growth |
| Scalability | Difficult; can't easily be taught or replicated | Easy; processes can be standardized and scaled |
While intuition will always have a place, relying on it alone is a gamble. A data-driven approach gives you a framework for making consistently better choices that build on each other over time.
The business case is clear and compelling. Companies that commit to data-driven decision-making don't just see marginal gains; they achieve a significant competitive advantage.
The numbers don't lie. Research shows that organizations that truly embrace this process are around 5% more productive and 6% more profitable than their less-informed competitors. They also tend to boost their operational efficiency by 15-20%. If you're interested in the details, you can read more about these compelling statistics and their implications.
This isn't just a textbook theory—it's a proven formula for building a stronger, more efficient, and more profitable business.
Defining Goals That Give Your Data Purpose

Let's be honest: the most powerful dataset in the world is completely useless without a clear mission. Diving into your analytics without a specific question in mind is like setting sail without a destination. You’ll drift around and eventually land somewhere, but it's almost certainly not where you needed to go.
This is where the real work of a data-driven decision-making process begins—by framing your objectives with precision. Without clear goals, it's easy to get stuck in "analysis paralysis," where you're swimming in data but have no real answers. The trick is to turn those fuzzy business aspirations into sharp, answerable questions that your data can actually tackle.
From Vague Ideas to Specific Questions
The first step is a simple but critical shift in perspective. Instead of making broad statements about what you want to achieve, start formulating questions that demand a data-backed answer. This small change focuses your team's energy and resources on what truly matters.
Here’s what that looks like in practice:
-
Instead of: "We need to boost our revenue."
-
Ask: "Which marketing channel delivered our customers with the highest lifetime value last quarter?"
-
Instead of: "We should improve customer satisfaction."
-
Ask: "What are the top three issues our customers mention in support tickets, and how do they correlate with churn?"
-
Instead of: "Our sales team needs to perform better."
-
Ask: "What common behaviors do our top-performing sales reps exhibit in their CustomerCloud communication cadence?"
Getting this specific ensures that every piece of data you collect and analyze has a job to do. It’s the strategic alignment that separates a successful data project from a deeply frustrating one. You'll know exactly what to look for and, more importantly, what to do with the insights you uncover.
The Power of Knowing Your Mission
Think of a well-defined objective as your North Star for the entire process. It tells you which metrics are vital and which are just noise. It’s a sobering thought, but some studies show that an astonishing 80% of a data analyst's time is often spent just cleaning and organizing data. Defining your goals upfront helps you cut through that noise and focus your efforts.
A clear mission doesn't just guide your analysis; it forces you to challenge your own assumptions. Many businesses run on long-held beliefs about their market or customers that might not hold up under scrutiny.
For instance, you might assume, "Our customers prefer email communication." It seems reasonable. But by setting a goal to identify the most effective engagement channel, you might find something surprising. Using CustomerCloud’s analytics, you could discover that your WhatsApp broadcasts actually get a 30% higher response rate.
That's the heart of a solid data-driven decision-making process: asking the right questions, checking your assumptions with real evidence, and letting the data show you the smartest path forward. This foundational step ensures you’re not just collecting data for the sake of it—you're collecting it with intent.
How To Collect and Prepare Data You Can Trust

Let’s be honest: the quality of your decisions hinges entirely on the quality of your data. If you’re feeding your analysis with messy, incomplete, or unreliable information, the insights you get will be just as flawed. This is where the real work of any credible data-driven decision-making process begins.
Good data rarely shows up perfectly packaged and ready to go. In my experience, it's usually scattered across a half-dozen platforms, each with its own formatting quirks and oddities. Your first mission is to round up these disparate pieces and forge them into a single, trustworthy source of truth.
Gathering Your Raw Materials
Before you can even think about analysis, you have to collect the right information. I like to think of this step like a detective gathering clues. Every data point is a small piece of evidence that helps you build a complete picture of your customer's journey.
Your primary sources will likely include a mix of the following:
- CustomerCloud Analytics: This is your goldmine for direct engagement data. You can track open rates on WhatsApp broadcasts, see response times in the support inbox, and follow entire conversation threads to understand what truly resonates with your audience.
- CRM Platform: Your Customer Relationship Management system is where you'll find crucial demographic information, detailed purchase histories, and lead sources.
- Website Analytics: Tools like Google Analytics are essential for understanding how users find you, which pages they linger on, and where they drop off.
- Social Media Insights: Don't forget the native analytics on platforms like Instagram or Facebook. They offer a wealth of data on audience demographics, post engagement, and campaign performance.
Pulling data from these different sources is a great start. But the real challenge—and frankly, where I see most organizations stumble—is in the cleaning and preparation phase.
The Crucial Step of Data Cleaning
This is easily the most important, and most frequently overlooked, part of the entire process. Raw data is messy. It's almost always full of errors, duplicates, and missing values that can completely skew your results. Taking the time to properly clean your data isn't just a suggestion; it’s non-negotiable.
Imagine an e-commerce company trying to calculate customer lifetime value. They pull sales data from one system and their support history from CustomerCloud. They immediately hit a snag: some customer names are spelled differently ("Jon Smith" vs. "Jonathan Smith"), and a chunk of purchase records are missing a customer ID. Without cleaning this up first, their analysis would be wildly inaccurate and ultimately useless.
Here’s a practical checklist for tidying up your data:
- Standardize Formats: Make sure everything is consistent. Are dates in the same format? Are names and categories uniform? For instance, ensure all state fields use two-letter abbreviations (e.g., "CA," not "California" or "Calif.").
- Handle Missing Values: You need a clear strategy for incomplete records. Sometimes you might remove them entirely. Other times, you might fill in the blanks with an average or a predicted value, depending on the context and how critical that data point is.
- Remove Duplicates: This one is huge. You have to identify and merge duplicate customer profiles to get a single, unified view. CustomerCloud helps here by automatically linking all conversations to a single contact, which dramatically simplifies this part of the job.
The real goal of data preparation isn't just to clean the data; it's to create a single, unified view of the customer. When you can see every touchpoint—from their first website visit to their most recent support chat—you can finally start making truly informed decisions.
This meticulous groundwork pays off in a big way. It’s no surprise that approximately 69% of companies are now using data insights to guide their choices, and a staggering 90% of enterprise businesses see data as increasingly vital to their operations. If you want to dig into the numbers, you can explore the full findings on data-driven adoption.
This foundational work is what makes a strategic reliance on data even possible. Once your data is clean and prepared, you're finally ready for the exciting part: uncovering the story hidden within your numbers.
Uncovering the Story Hidden in Your Numbers
Once your data is clean and organized, the real fun begins. This is where you shift from just looking at raw numbers to actually seeing the story they're trying to tell you. Let's be honest, a spreadsheet full of metrics is just noise. It’s the insightful visualizations and deep dives that let you spot the trends, patterns, and outliers that reveal what’s truly happening with your business.
This whole process is about turning information into action. This visual breaks down the core loop.
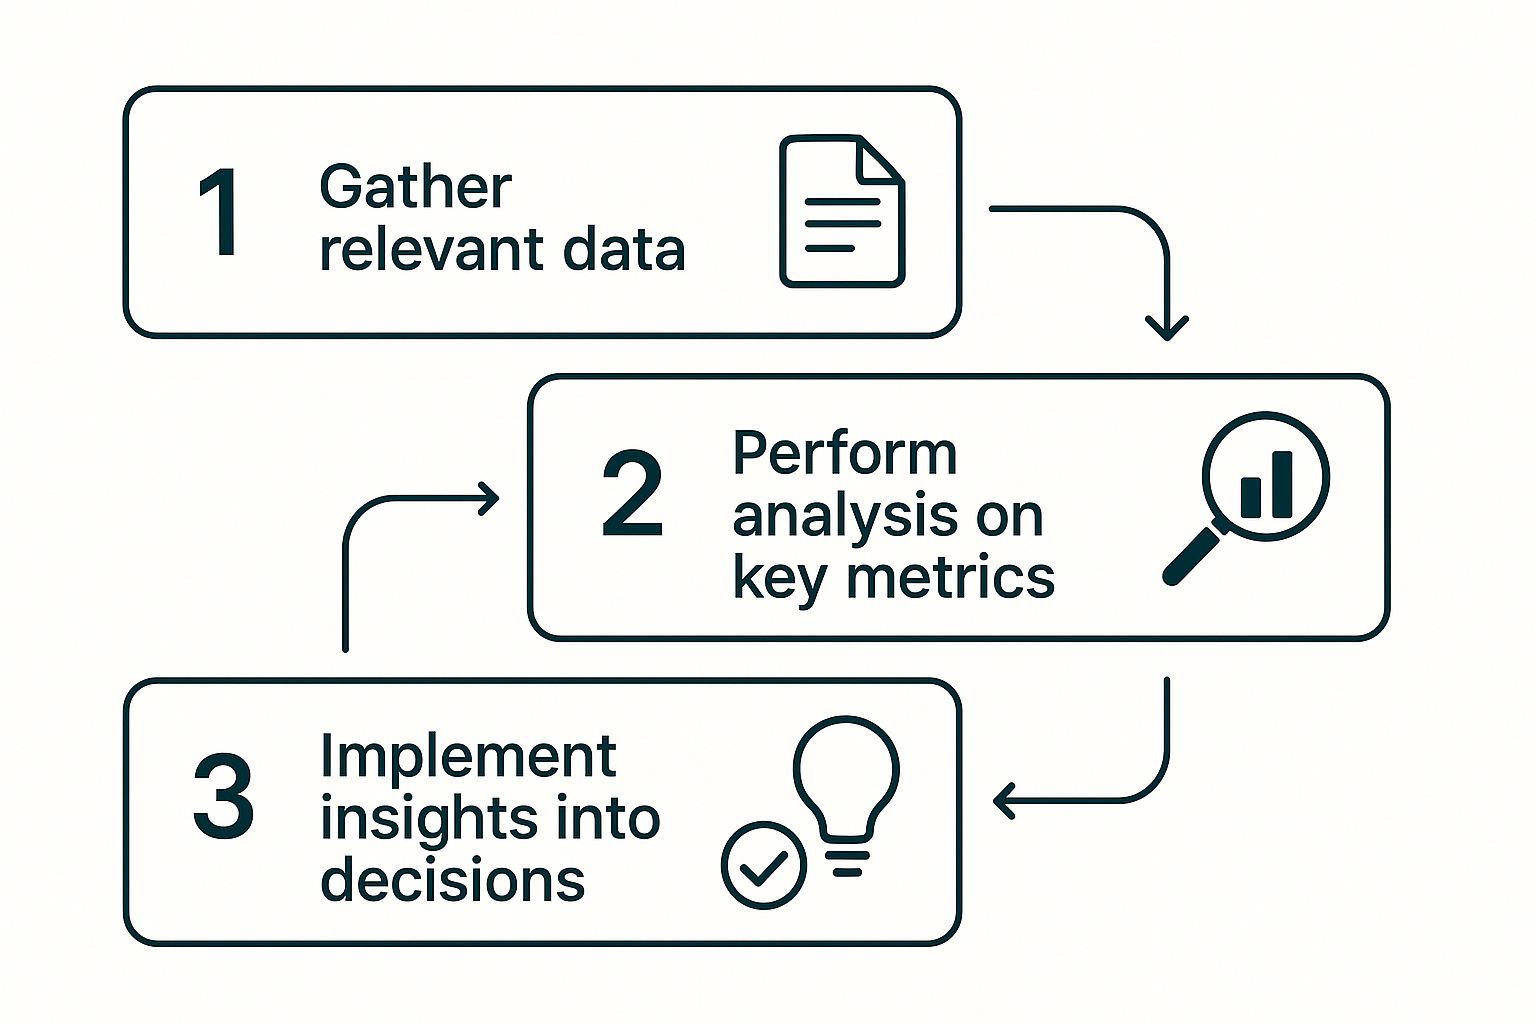
It’s a simple but incredibly powerful cycle: you gather your data, you figure out what it means, and then you use those findings to make smarter moves.
This analysis stage isn't just a one-and-done task; it's more like a detective investigation. You’re not just asking what happened. You need to push further and figure out why it happened. That's the difference between basic reporting and generating real business intelligence.
From What to Why
Good analysis usually unfolds in two key stages. Each one answers a different kind of question, with one stage building on the next to give you the full picture.
-
Descriptive Analysis (What Happened?): This is your starting block. You're using tools like CustomerCloud’s real-time dashboards to get a bird's-eye view of past events. Think of it as answering the straightforward questions: "What was our average customer response time last month?" or "Which WhatsApp broadcast had the best open rate?" This gives you the hard facts you need to start with.
-
Diagnostic Analysis (Why Did It Happen?): Now we're getting to the good stuff. If your descriptive analysis shows one marketing broadcast knocked it out of the park, diagnostic analysis is where you ask why. You might dig in and realize it was sent at a specific time of day, or maybe the phrasing you used just clicked with your audience. These are the "aha!" moments that drive real improvement.
A Practical Example in Action
Let’s make this real. Imagine you run a software company and your top priority is cutting down on customer churn. You've got all your user engagement data from your platform and your support conversations from CustomerCloud ready to go.
First, your descriptive analysis shows a stark trend: 70% of users who cancel their subscription logged in fewer than three times during their first month. That’s a powerful “what.”
Now for the diagnostic part—the “why.” You start cross-referencing that user activity data with the support tickets you have in CustomerCloud. A pattern immediately jumps out. A huge chunk of those churned users had submitted tickets because they were confused about one specific advanced feature. They weren't seeing the value simply because they were getting stuck.
This is the heart of an effective data-driven decision-making process. It goes beyond reporting a metric and gives you a clear, actionable reason behind the number. You didn't just find a correlation; you found a cause.
Armed with that insight, your next steps become crystal clear. You could create a targeted onboarding flow that walks new users through that tricky feature. Or maybe you could set up an automated in-app message that offers help the moment a user navigates to that part of the software.
This is how data stops being a passive report and becomes an active tool for growth. You’ve pinpointed a major friction point, understood its business impact, and now you have a data-backed plan to fix it—tackling the root cause of churn and paving the way for measurable improvements.
Turning Insights Into Action and Measuring What Matters
An insight is just an interesting fact until you do something with it. This is the stage where all your hard work analyzing data pays off—turning what you've learned into real business impact. The idea is straightforward: take your findings, build a plan, and then obsessively measure the results.
This isn't a one-and-done deal. It's about creating a powerful feedback loop. The results from today’s actions become tomorrow's raw data, kicking off a cycle of continuous improvement that separates the good from the great.
Validating Your Ideas With A/B Testing
So, your analysis has uncovered a potential goldmine. What now? The temptation is to go all-in and change everything at once. Resist that urge. The smarter move is to run a controlled experiment to see if your hypothesis holds water. This is where A/B testing becomes your most valuable tool.
Let's say your digging in CustomerCloud suggests that customers are more responsive to shorter, punchier WhatsApp broadcast messages. Instead of immediately rewriting your entire messaging playbook, you set up a simple test:
- Group A (the Control): Gets the same old longer message you've always used.
- Group B (the Variant): Gets the new, short-and-sweet version.
From there, you jump into CustomerCloud’s analytics and watch the numbers roll in. You’re looking at open rates, click-through rates, and maybe even reply rates for both groups. If Group B knocks it out of the park, you’ve just proven your theory. That's the kind of concrete evidence you need to confidently roll out the change to everyone.
The best decisions aren't just data-driven; they're data-validated. Testing takes the guesswork out of the equation and replaces it with proof, making sure your changes are actual improvements, not just stabs in the dark.
This careful approach helps you avoid costly missteps and ensures you're putting your time and money into strategies that actually move the needle.
Setting KPIs to Measure What Really Matters
After you’ve rolled out a change, how do you know if it's working over the long haul? You need to define your Key Performance Indicators, or KPIs. These are the specific, measurable signposts that tell you if you're on the right track.
For that new messaging strategy we talked about, your KPIs might include:
- Customer Engagement Rate: Are people actually interacting with your new messages?
- Conversion Rate: Are more people taking the action you want them to take?
- Customer Churn Rate: Are happier, more engaged customers sticking around longer?
This is also where AI is becoming a bigger part of the picture. A recent McKinsey Global Survey found that around 65% of respondents are already using generative AI to help with their decision-making. What’s more, 75% believe it’s going to fundamentally change their industry. You can see more stats on how Gen AI is shaking things up for businesses.
By keeping a close eye on your chosen KPIs, you officially close the loop on your data driven decision making process. The performance of your actions generates fresh data, which fuels new questions and kicks off the next cycle of analysis, testing, and improvement.
Common Questions About Making Data-Driven Decisions
As you start weaving data into your daily decisions, you're going to have questions. It's a big change, and it's smart to think through the practical side of things. Here are a few of the most common questions we get from teams making this leap, along with some straight answers from our experience.
What Are the Biggest Roadblocks When Getting Started?
Honestly, the toughest challenges are almost always about people, not technology. So many companies get excited and start gathering every piece of data they can find without first asking, "What problem are we trying to solve?" This leads to a lot of noise and wasted effort. If you don't have a clear question, all data looks equally important.
Another huge one is messy data. When you pull information from different places, it’s often inconsistent or incomplete. You'll spend a ton of time just cleaning it up before you can even begin to trust what it's telling you. And finally, expect some skepticism. People who are used to trusting their gut might be wary of this new approach. You have to show them the value with clear training and, most importantly, some early wins.
The most common failure point isn't a lack of tools; it's a lack of alignment. Getting buy-in from leadership and clearly communicating the why behind the shift is just as important as the technical setup.
How Can a Small Business Do This Without a Big Budget?
You don't need a team of data scientists or a six-figure software budget to start making smarter decisions. The secret is to start small and be incredibly focused. Pick just one important business question to tackle.
For instance, a great first question is, "Where do our most profitable customers really come from?"
You can start answering this with tools you probably already have, like Google Analytics, and combine that information with the analytics built right into your CustomerCloud account. The idea is to get a quick, tangible win on a single, high-impact project. Once you can point to a real result, it's so much easier to get support for doing more. Don't try to boil the ocean; just focus on the few metrics that drive your most important goals.
How Long Until We See Actual Results?
This varies, of course, but you can see your first "Aha!" moments much faster than you’d think. Within just a few weeks of focused analysis, you might spot something immediately actionable—like an ad campaign that's burning cash with zero return. Cutting it is a quick win you can take to the bank.
However, creating a true data-driven culture is a marathon, not a sprint. The bigger, more profound impacts on your bottom line—like sustained profitability and deep operational efficiencies—usually take a few quarters to materialize. The real magic happens when that "implement, measure, learn" cycle becomes second nature for your whole team.
Is AI a Must-Have for This?
No, AI isn't required to get started, but it becomes a massive advantage as you scale. Your initial data-driven decisions will be about understanding what already happened. You can answer those "what happened?" questions perfectly well with standard analytics tools.
Where AI becomes a total game-changer is when you move into prediction and recommendation.
- Predictive Analytics: AI can look ahead and forecast future trends with a level of accuracy that’s tough to achieve manually.
- Prescriptive Analytics: It can go a step further and suggest the best actions to take based on those predictions.
As your business grows and your data gets more complex, AI can spot subtle patterns in massive datasets that a human would never catch. It adds a powerful new layer to your decision-making.
Ready to build a smarter, more responsive business? With CustomerCloud, you get all the tools you need to track engagement, analyze customer behavior, and turn your data into your greatest asset. Explore our features and start making better decisions today.