Picking the right business intelligence software means looking closely at the heavy hitters like Microsoft Power BI, Tableau, and CustomerCloud. You have to weigh their features, pricing, and AI chops. A solid business intelligence software comparison quickly shows that some tools are built for massive enterprise-level reporting, while others are laser-focused on customer analytics. The "best" choice really just comes down to what you're trying to achieve.
Understanding the BI Software Landscape

At its core, business intelligence (BI) software takes raw, messy data and turns it into insights you can actually use. Think of it as a translator, taking complex numbers and converting them into clear, visual stories told through charts, graphs, and dashboards. The goal is simple: let everyone in the company, from the C-suite to the marketing analyst, make smart decisions without needing a Ph.D. in data science.
This need is fueling some serious market growth. The global BI software market hit a value of USD 41.74 billion in 2024 and is on track to blow past USD 151.26 billion by 2034. That boom tells you just how essential these platforms have become for building a company strategy that’s backed by real data. You can discover more market growth insights on precedenceresearch.com.
Core Criteria for Our Comparison
To make this business intelligence software comparison useful, we need to evaluate everyone on a level playing field. We’ll be digging into our top contenders—Microsoft Power BI, Salesforce (Tableau), SAP, and CustomerCloud—by looking at these key areas:
- Data Visualization: How good is the tool at actually showing you the data? We're talking chart variety, dashboard interactivity, and whether a non-technical user can make sense of it all at a glance.
- Integration Capabilities: A BI tool is useless if it can't connect to your data. We'll check how well each platform plays with different data sources, from old-school databases and spreadsheets to modern cloud apps.
- AI and Advanced Analytics: Good BI isn't just about what happened yesterday. We'll look at forward-looking features like predictive modeling, asking questions in plain English (natural language queries), and AI that automatically spots trends for you.
- Total Cost of Ownership (TCO): The sticker price is just the beginning. We’ll break down the licensing models, implementation headaches, and any hidden costs to get a real sense of the total investment.
Introducing the Market Leaders
Each of these platforms comes to the table with a different angle. Microsoft Power BI is a natural fit for companies already deep in the Microsoft ecosystem, offering tight integrations and a familiar feel. Tableau, now under the Salesforce umbrella, has long been the gold standard for beautiful, intuitive data visualization. SAP is an enterprise beast, perfect for large corporations with complex operational data tied to their ERP systems.
Then there’s CustomerCloud, a newer player that carves out its niche by focusing squarely on customer-centric analytics. It’s built to help you understand user behavior and engagement on a deeper level. By the time we’re done, you’ll have a much clearer picture of which tool is the right fit for your team’s specific needs and long-term goals.
A Look at the Main Players in Business Intelligence
Before we dive into a side-by-side comparison, it’s worth getting to know the major platforms shaping the BI world. The market is surprisingly concentrated, with just a handful of vendors leading the charge.
In fact, the top 10 BI companies own about 64.1% of the entire global market. Salesforce (with its Tableau platform) sits at the top, holding a 14.8% market share, with giants like SAP and Microsoft right behind. This tells you a lot about the influence and reliability of the tools we're about to break down. If you're curious, you can dig into a more detailed market share breakdown to see how things stack up.
Each of these tools has its own unique philosophy and technical setup, built for different kinds of businesses and challenges. Let's meet the four contenders at the center of our review.
Microsoft Power BI: The Ecosystem Integrator
For any company already running on Microsoft products, Power BI is often the first stop. Its biggest advantage is how effortlessly it plugs into Office 365, Azure, and Dynamics 365. For a dedicated Microsoft shop, it’s a no-brainer.
The interface feels a lot like Excel or PowerPoint, which really helps bring down the learning curve for new users. This familiarity means teams can get up and running, building their first reports and dashboards, in no time. It’s built for both broad enterprise reporting and letting individual teams handle their own analytics.
Salesforce (Tableau): The Visualization Pioneer
Tableau, now a key part of the Salesforce ecosystem, earned its reputation by making data beautiful. It’s still considered the gold standard for creating stunning, interactive visuals that just make sense. Its drag-and-drop interface is what truly empowers people to explore data without needing to be a tech wizard.
At its core, Tableau is all about turning dense, complicated datasets into clear, compelling stories. While it's incredibly powerful on the front end, it really shines when connected to a well-structured data warehouse, as its main job is to handle the presentation and exploration of that data.
Key Differentiator: Tableau’s real magic lies in its unmatched ability to enable visual data discovery. It’s built to encourage you to ask questions by simply clicking and interacting with charts, which is why it has become a favorite tool for data analysts and anyone trying to tell a story with numbers.
SAP: The Enterprise Powerhouse
SAP BusinessObjects is one of the old guards of the BI world, with deep roots in massive, complex enterprise settings. Its biggest selling point is its native integration with SAP’s own ERP systems. If your company’s core operations run on SAP, this is often the default choice.
It offers a massive suite of tools for reporting, querying, and in-depth analysis designed for the kind of complex corporate data that global organizations deal with. SAP is engineered for situations that demand strict governance, tight security, and the ability to scale across worldwide operations without a hitch.
CustomerCloud: The Customer-Centric Specialist
Unlike the one-size-fits-all platforms, CustomerCloud has carved out a very specific niche: customer engagement analytics. It was built from the ground up to do one thing exceptionally well—unify communication data from channels like WhatsApp with all your support tickets and sales conversations.
This sharp focus means it comes with ready-to-go models and dashboards designed specifically for understanding customer behavior, measuring support team efficiency, and tracking marketing campaign results. For any business where customer interaction data is the most valuable asset, CustomerCloud delivers a direct solution that general-purpose tools would need a lot of custom work to even come close to.
A Detailed Feature and Usability Comparison
Choosing the right BI tool isn't just about flashy features. What really matters is how it performs day-to-day. A slick interface is useless if you can't connect your data sources or if sharing a simple report turns into a major headache. This comparison will go beyond the marketing hype to dig into the practical usability of CustomerCloud, Microsoft Power BI, and Salesforce (Tableau).
We're going to focus on three core areas that directly impact your team's workflow: how easily each platform pulls in your data, the power and feel of their dashboarding tools, and how flexible they are for reporting and sharing. These are the things that make a BI tool either a go-to asset or a source of constant frustration.
Data Connectivity and Integration Flexibility
The first hurdle for any BI platform is getting to your data, no matter where it's stored. The process needs to be straightforward and reliable, whether you're pulling from an old database or a modern cloud app.
-
Microsoft Power BI is, unsurprisingly, king within the Microsoft ecosystem. Connecting to Azure SQL, Dynamics 365, or even a basic Excel sheet is almost instant. It has a huge library of native connectors, but its real power comes from how seamlessly it fits with other Microsoft products.
-
Tableau takes a more universal approach. It boasts an enormous range of connectors for databases, cloud warehouses like Snowflake and Redshift, and countless business applications. Its biggest strength is its performance with massive, well-organized datasets, which makes it a favorite for companies with a dedicated data warehouse.
-
CustomerCloud zeroes in on a specific set of integrations. While it handles standard databases, its pre-built connectors for platforms like WhatsApp are what make it stand out. This focus means you don't need to build complex, custom solutions just to analyze customer engagement data.
For teams already deep in Microsoft’s cloud and office tools, Power BI offers an incredibly smooth, native experience. But if your data is spread across a diverse, non-Microsoft landscape, Tableau’s broad connectivity gives you much more flexibility.
Dashboarding and Visualization Experience
Once the data is flowing, the real work begins: finding the story within the numbers. The quality of a tool's dashboard builder and visualization engine dictates how well your team can explore data and share what they find.
Take a look at Power BI's clean, familiar interface. It's a big reason new users can get comfortable and start building reports so quickly.
This design approach dramatically shortens the learning curve for anyone who’s already spent time in tools like Excel.
Tableau, on the other hand, is widely seen as the gold standard for data visualization. Its fluid, drag-and-drop interface practically begs you to get creative and explore. The engine is built to handle highly interactive and beautiful dashboards that can manage complex user filters and drill-downs without slowing down.
CustomerCloud offers a more guided dashboarding experience. It's packed with pre-configured templates and charts specifically for metrics like support ticket volume, campaign engagement, and agent performance. It gets you to the insights you need faster, but it doesn't offer the same creative canvas as a general-purpose tool like Tableau.
To help you see the differences at a glance, here’s a breakdown of how the core features stack up.
Core Feature Comparison of Leading BI Tools
This side-by-side evaluation of key functionalities across CustomerCloud, Power BI, and Tableau can help you quickly identify the best fit for your team's needs.
| Feature Category | CustomerCloud | Microsoft Power BI | Salesforce (Tableau) |
|---|---|---|---|
| Primary Use Case | Customer engagement & support analytics | General business intelligence for the Microsoft ecosystem | Advanced data visualization & enterprise-scale analytics |
| Data Connectivity | Specialized connectors (e.g., WhatsApp), standard databases | Extensive native connectors, especially for Microsoft products | Widest range of connectors for databases, cloud & apps |
| Ease of Use | Very easy; guided templates | Easy for Excel users; moderate learning curve for advanced features | Moderate to steep learning curve; requires data literacy |
| Visualization | Pre-built, goal-oriented charts | Strong, flexible visualizations with a familiar interface | Best-in-class; highly customizable and interactive visuals |
| Mobile Experience | Real-time KPI monitoring for managers | Tightly integrated with Microsoft mobile apps, data alerts | Rich, interactive dashboard exploration on any device |
| Integration | Deep integration with communication platforms | Seamless with Azure, Office 365, Dynamics | Broad integration capabilities via APIs and partners |
Each tool clearly carves out its own niche. CustomerCloud is purpose-built for a specific job, Power BI makes BI accessible for millions of Microsoft users, and Tableau empowers data experts to dig deeper than anyone else.
Reporting Automation and Sharing Capabilities
Building a great dashboard is only half the job. Getting those insights to the right people at the right time is just as crucial. This is where features like automation and mobile access come into play.
All three platforms have solid sharing options. You can embed dashboards into other apps, schedule reports to be sent via email, and lock down access with user-based permissions.
Where they differ is in the mobile experience:
- Tableau Mobile delivers a rich, interactive experience, letting you drill down into data right from your phone or tablet.
- Power BI Mobile is tightly woven into other Microsoft mobile apps, offering handy features like data-driven alerts and the ability to annotate charts.
- CustomerCloud keeps its mobile access focused on real-time monitoring of key metrics, perfect for managers who need a quick pulse check on the go.
The adoption numbers in the market often tell a story about usability. Microsoft Power BI has achieved a massive global footprint, capturing over 30% of the BI market share in 2021 with more than 30 million active monthly users. By comparison, Tableau held a very respectable 16.99% share, serving around 100,000 organizations. You can get a full picture from these business intelligence market statistics and insights.
Power BI’s widespread adoption is partly due to how easy it is for anyone familiar with the Microsoft suite to pick it up, which just goes to show how much usability matters in any BI software comparison.
Comparing AI and Advanced Analytics Capabilities
Let’s be honest, modern BI is about more than just slick charts. The real muscle is in the advanced analytics and AI that can tell you what’s likely to happen next, not just what happened last month. This is where you really start to see the differences in a business intelligence software comparison, as it’s what separates a basic reporting tool from a true strategic asset.
We’re going to look at how CustomerCloud, Microsoft Power BI, and Tableau handle AI. Each has a completely different philosophy on how to deliver those deeper, predictive insights.
AI for Specialized vs. General Use Cases
Right away, you see a major split in how these platforms apply AI. Some give you a broad, all-purpose AI toolkit, while others hand you highly specialized models ready to solve specific problems right out of the box.
CustomerCloud is all about focus. It comes with pre-built predictive models engineered specifically for forecasting customer behavior. That means you can immediately start digging into things like churn risk or potential customer lifetime value without needing a data scientist to build everything from the ground up.
- Real-World Scenario: An e-commerce manager using CustomerCloud can use its predictive models to figure out which customer segments will likely respond best to an upcoming campaign. This lets them sharpen their ad spend by targeting the most promising audiences before a single dollar is spent.
Microsoft Power BI plays a different game by tapping into the massive Azure ecosystem. Its AI features, like ‘Quick Insights,’ can automatically comb through your datasets to spot correlations, outliers, and trends a human analyst might easily miss. For more complex needs, it integrates directly with Azure Machine Learning, giving data science teams a familiar space to deploy their own custom models.
- Real-World Scenario: A financial analyst with Power BI can set up automated anomaly detection to keep an eye on transaction data. The system can flag strange patterns that might hint at fraud and fire off an alert for review, all without anyone having to manually sift through reports.
Tableau takes a more human-centric approach, making AI accessible through natural language. Its 'Ask Data' feature lets you type questions in plain English—think "show me top 10 product sales in the Northeast last quarter"—and get a visualization back instantly. This really lowers the barrier to entry, empowering more people to explore data on their own terms.
Practical Implementation of AI Features
Having powerful AI is great, but if it’s a pain to use, it won’t get used. The user experience around these advanced features is a huge differentiator that directly impacts how much value your team gets.
Power BI’s approach feels like it’s augmenting your workflow. AI features are woven directly into the report-building process, suggesting insights and explanations as you go. It’s almost like having an automated assistant looking over your shoulder and pointing out interesting patterns.
Key Differentiator: CustomerCloud’s AI is purpose-built for one thing: customer engagement. Because it’s so specialized, its predictive models for churn and user behavior are often far more accurate for those specific tasks than a general-purpose AI model would be.
Tableau, in contrast, designs its AI for exploration and discovery. The ‘Ask Data’ feature really encourages a conversational style of analytics, which makes the whole process feel less intimidating for people who don't live and breathe data.
Evaluating the Depth of Analytics
At the end of the day, the depth of a platform's analytics determines the kinds of questions you can answer. This is where you see each tool’s core audience come into focus.
Here’s a quick breakdown of where their advanced analytic strengths lie:
| Analytic Capability | CustomerCloud | Microsoft Power BI | Salesforce (Tableau) |
|---|---|---|---|
| Predictive Modeling | Built-in models for customer behavior | Integration with Azure Machine Learning | Connects to external modeling tools |
| Natural Language Query | Not a primary feature | Q&A feature for dashboards | 'Ask Data' for conversational exploration |
| Automated Insights | Focused on customer journey alerts | 'Quick Insights' for general data discovery | Limited native automated features |
| Target User | Marketers and support managers | Business analysts and data scientists | Data analysts and business users |
The trade-offs are pretty clear. CustomerCloud delivers powerful, focused insights with minimal setup, making it a fantastic choice for teams who need immediate answers about their customers. Power BI and Tableau offer more of a flexible, customizable toolkit that can tackle almost any analytical challenge, but they generally require more technical skill to get the most out of them. The right choice really comes down to your team’s expertise and the specific problems you’re trying to solve.
Breaking Down Pricing and Total Cost of Ownership

When you're comparing business intelligence software, the sticker price is just the starting point. The real story is in the total cost of ownership (TCO). This includes everything: user licenses, data storage, implementation time, and even the cost of hiring people with the right skills. A tool that looks like a bargain upfront can quickly become a money pit once you factor in all the necessary add-ons and support.
To get a clear financial picture, you have to understand how each platform structures its pricing. Power BI, Tableau, and CustomerCloud all have very different philosophies that cater to different types of users and business needs. Let's dig in and look past the simple monthly fee.
Evaluating Different Pricing Tiers
Every platform uses a tiered system, but what you get for your money can vary wildly. The best tier for you really comes down to who needs access to the data and what they’ll be doing with it.
-
Microsoft Power BI: This platform has one of the lowest barriers to entry. Its Pro license is incredibly affordable at around $10 per user per month. The catch? If you need to work with larger datasets or want dedicated server capacity, you'll have to jump to the Premium tier, which can run into thousands per month. It's a fantastic value if your company is already deep into the Microsoft 365 ecosystem.
-
Salesforce (Tableau): Tableau takes a role-based approach. A "Creator" license—for the people actually building dashboards and data sources—is the priciest at about $70 per user per month. From there, "Explorer" and "Viewer" licenses get progressively cheaper, making it a flexible choice for organizations that have a few data gurus and many more people who just need to see the reports.
-
CustomerCloud: Instead of a generic model, CustomerCloud ties its pricing directly to the value of its specialized features. Its tiers are built to grow with your customer engagement activities, bundling the cost of its pre-built AI models and specific connectors right into the plan.
Uncovering Potential Hidden Costs
Don't let the monthly subscription fool you; it's rarely the final number. Hidden costs can sneak up and blow your budget if you aren't paying attention. These usually pop up around data handling, premium connectors, or needing to bring in outside help.
For instance, both Power BI and Tableau can charge extra for connecting to certain data sources or for more advanced data prep. If your data isn't clean and perfectly structured—and let's be honest, it rarely is—you might need to invest in more tools or developer time just to get it ready for analysis. That all adds to your TCO.
A key consideration here is the cost of expertise. General-purpose tools like Tableau often require a skilled analyst to build truly meaningful dashboards from scratch. CustomerCloud, on the other hand, comes with pre-configured reports for customer analytics, which dramatically reduces the need for specialized hires or lengthy training, ultimately lowering the TCO.
How Pricing Scales with Your Team
Any BI tool you choose is a long-term investment, so you need to think about how the costs will change as your company grows. A solution that’s perfect for a five-person team might be financially crippling for a fifty-person department.
Power BI’s per-user model is simple and great for small teams. But the jump from individual licenses to its capacity-based Premium pricing is a big one. Once you outgrow the basic plan, be prepared for a significant financial leap. Tableau’s role-based model gives you more precise control over spending as you add users, since you can assign licenses based on what each person actually needs to do.
CustomerCloud’s pricing is built to scale alongside your customer base and engagement volume. This approach ties your costs directly to business value, so you’re paying for capabilities that have a real impact on your customer-focused goals. It creates a much more predictable cost structure for any business scaling its marketing and support teams, making it a critical point to consider in your business intelligence software comparison.
So, How Do You Choose the Right BI Tool?
After digging through all the comparisons, the last step is making the actual decision. Let's be clear: there's no single "best" BI tool. The right one for you depends entirely on your company's situation, what resources you have, and what you’re trying to achieve. Instead of a one-size-fits-all answer, here’s some practical advice based on common business scenarios.
The trick is to map your specific needs to a platform's core strengths. A tool that’s perfect for a massive enterprise could completely overwhelm a small startup. On the flip side, a niche platform might be too restrictive for a team with broad analytical needs.
Best for Startups and Marketing Teams
If you're a startup or a marketing team, your world revolves around customer analytics and getting insights fast. You probably don't have a team of data scientists on standby, so you need a solution that works right out of the box without a massive setup headache.
Recommendation: CustomerCloud is really built for this.
It comes with pre-built connectors for platforms like WhatsApp and has AI models ready to go for analyzing customer behavior. This means a marketing team can start digging into campaign engagement and support chats almost immediately, without having to build custom data models from the ground up. That specialized focus dramatically lowers the total cost of ownership because you don't need to hire expensive technical experts to get it running.
Ideal for Businesses Already in the Microsoft Ecosystem
For companies deeply invested in Microsoft products—think Office 365, Azure, and Dynamics 365—sticking with that ecosystem just makes sense. Seamless integration and a familiar user experience are huge wins here.
Recommendation: Microsoft Power BI is the obvious choice.
Its native integration is a game-changer. You can pull data from Excel or Azure SQL with just a few clicks, creating a workflow that feels completely natural. Plus, the interface will feel comfortable to anyone who’s ever used a Microsoft product, which slashes training time. If your goal is to get everyone in the company using data for self-service analytics, Power BI's low cost and deep integration are tough to beat.
Your final choice should be a strategic one. Don't just pick the tool with the longest feature list. Choose the platform that solves your biggest business problems and fits with your team's current skills and tech stack.
Perfect for Enterprises with Dedicated Data Teams
Large companies with established data warehouses and skilled teams of analysts have different needs. They require a platform with serious flexibility, powerful visualization capabilities, and the muscle to handle enormous, complex datasets.
Recommendation: Salesforce (Tableau) is still the gold standard here.
Tableau’s real power is its best-in-class visualization engine. It gives data pros the tools they need to truly explore information and uncover deep insights. It's designed for high performance at a massive scale and connects to just about any data source you can think of. For organizations where data storytelling and detailed, interactive dashboards are essential, Tableau provides the powerful, creative canvas that expert analysts need to shine.
Frequently Asked Questions About BI Software
Making a smart choice in a business intelligence software comparison often comes down to the practical stuff—how it gets set up, what it really does for your bottom line, and if it plays nice with the tools you already use. Getting straight answers here is non-negotiable before you sign on the dotted line.
What Is the Typical Implementation Time for a BI Platform?
Honestly, it varies. You could be looking at a few weeks or even several months. The timeline really hinges on the complexity of your data, how many different sources you need to pull from, and the size and tech-savviness of your team.
For example, a tool like CustomerCloud can get you up and running relatively quickly for customer-focused analytics because it has pre-built connectors for platforms like WhatsApp. On the other hand, a massive enterprise tool might demand a lot of heavy lifting with data warehousing and prep work before you even think about building your first dashboard.
A phased rollout is almost always the best strategy. Kick things off with a single, high-impact project to prove the tool's value right away. This approach builds momentum and lets you learn from the process before you expand it to the whole company.
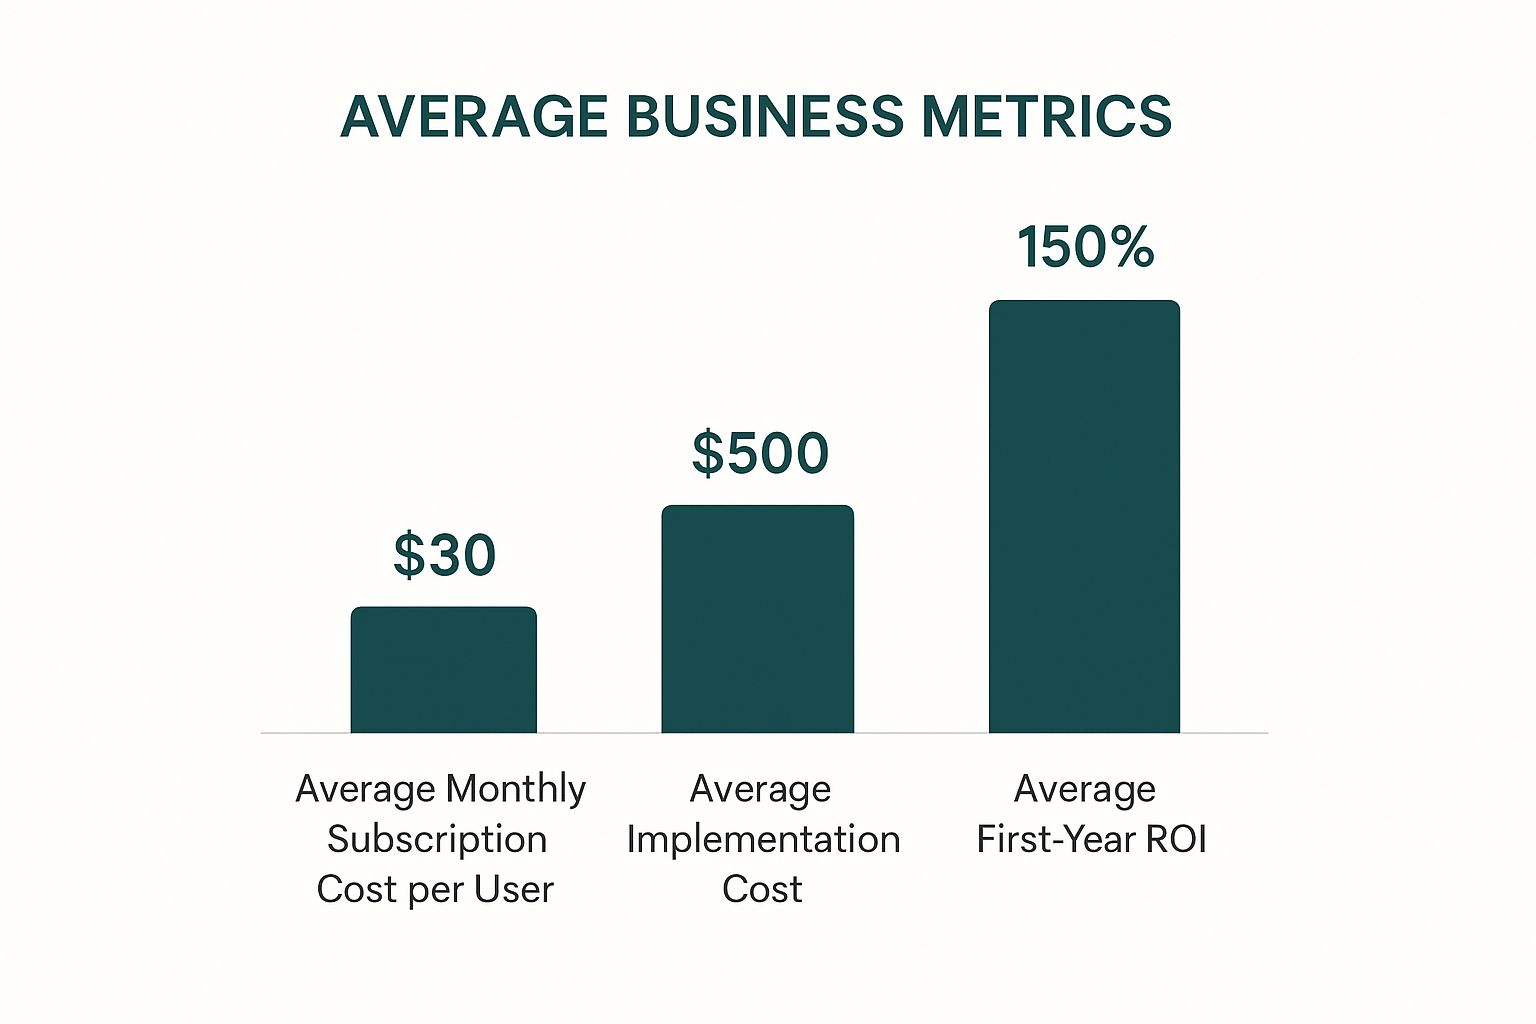
How Do I Measure the ROI of My BI Software?
Measuring the return on investment for BI software isn't just about watching revenue go up, although that’s a great outcome. The most immediate value you'll likely see is in how much more efficient your operations become.
Think about tracking these key metrics:
- Time Saved on Reporting: Just add up the hours your team used to burn pulling together reports in spreadsheets. Automating that drudgery frees up smart people to do actual analysis.
- Improved Decision Accuracy: Compare the results of decisions made with BI insights versus the old "gut feeling" approach. You should see tangible improvements in areas like marketing campaign performance or inventory control.
- Increased Data Accessibility: When a BI tool is working well, more people across the company can answer their own questions without bottlenecking your data analysts.
Can BI Software Integrate with My Existing Tech Stack?
Yes, but how easily it integrates is a make-or-break question in any business intelligence software comparison. Big players like Power BI and Tableau come with huge libraries of native connectors, letting you plug into hundreds of common apps and databases with just a few clicks.
But if you’re running on custom-built or more niche systems, you’ll need to dig into the platform’s API capabilities. A solid, well-documented API gives your developers the power to build those custom bridges, ensuring data flows smoothly from your unique tools into your BI platform. Always double-check that a potential tool has the specific connectors you need or a robust API to save yourself major integration headaches later.
Ready to see how a specialized BI tool can transform your customer engagement? CustomerCloud integrates your communication channels into one powerful analytics platform. Explore our features and start making data-driven decisions today.